
Emissions reporting from the routes you actually plan and drive
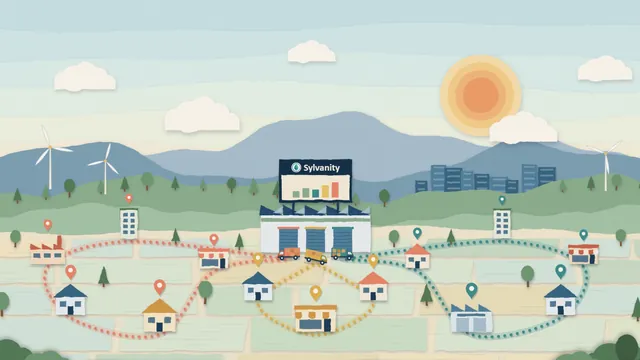
Every kilometre leaves a footprint, and an empty trip leaves one for nothing. Reporting it usually means spreadsheets, estimates and long evenings. Because we plan the routes, we can add up kilometres, loads and vehicles into an emissions report per route, customer and period, to support your sustainability reporting.
ESG & CO2 reporting · 36 s
Reporting built from spreadsheets and estimates
Customers, lenders and regulators increasingly ask for transport emissions, often per customer. The data sits in different places: plans, fuel cards, telematics, invoices. Bringing it together is manual work, and the result often rests on averages rather than the routes that were actually driven.
That costs time at every reporting moment, figures that are hard to explain to a customer or auditor, and no clear view of where better planning is already reducing emissions.
Empty kilometres, invisible
Empty and half-full trips add emissions without delivering anything, and rarely show up in the numbers.
Long evenings with spreadsheets
Each report means collecting data from several systems by hand.
Figures hard to explain
Averages and estimates are difficult to break down per customer or defend when someone asks how they were made.
A report built from the plan and the driven kilometres
We combine the planned routes with what was actually driven and with your vehicle data, and calculate emissions per route, per customer and per period with a transparent method. The report supports your reporting; your sustainability team decides how it is used.
What goes in
- Planned routes, stops and loads
- Driven kilometres from telematics or trip records
- Vehicle types and fuel or energy data
- Emission factors you choose or already use
How it is calculated
- Per route, per customer and per period
- Planned and driven kilometres kept side by side
- Empty and partly loaded kilometres shown separately
- Method and factors documented with every report
What you see
- Emissions per route, customer and period
- Kilometres avoided by better planning, against your baseline
- Exports for your sustainability reporting
- The detail behind every number, down to the trip
Numbers you can trace, not promises
We quote no reduction figures in advance. What we deliver is a traceable report: every figure can be followed back to the routes, kilometres and factors it came from, so your team can check it before it goes into any report.
The report supports your sustainability reporting; it is not a certification or assurance. Outcomes depend on your data and the factors used, and are not guaranteed.
- Coverage
- Every planned and driven route included
- Traceability
- Every figure back to trips and factors
- Effort per report
- Compared with your current process
Bring one planning problem to a working session
Tell us where planning hurts today. In one session we map it to the modules that fit, and what a shadow run on your data would look like.
Schedule an appointment
Real-time availability. Instant Teams invite.
- Direct with our engineers
- Cancel or reschedule any time